
REU, Vermont EPSCor
2019
Giorgio Sarro, University of Wisconsin-Milwaukee.
Caitlin Crossett, University of Vermont.
Lesley-Ann Dupigny Giroux, Vermont State Climatologist, University of Vermont.


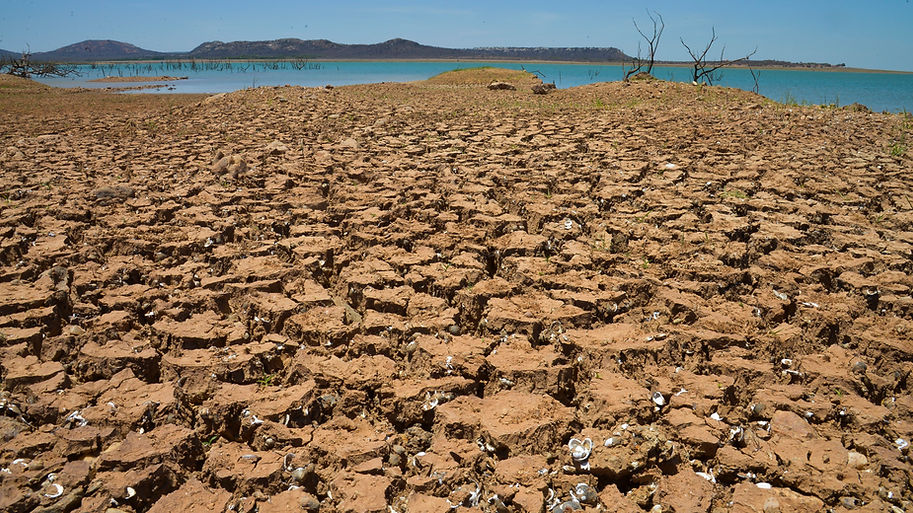
Picture: Marcello Casal Jr/Agência Brasil
Introduction
The North-East of the United States is a region characterized by abundant moisture and precipitation throughout the year, nevertheless, drought events can still be a threat. Specifically, droughts can harm socio-economic activities and the ecosystems as drier conditions are out of the norm in such a region that is dependent on constant water supply. Recent climate studies demonstrated that, since the 1964-1967 droughts, we currently live in a period of above normal precipitation [Pederson et al. 2013]. Some studies highlight that anthropogenic climate change could lead to a greater interannual variability of soil moisture [Sweet et al. 2017], with moist events followed by dry periods. Consequently, understanding the nature of droughts in the region of Vermont, New Hampshire and eastern New York becomes increasingly important.
There are only a handful of studies examining summer droughts in the region of study, and there have been no detailed studies to date, that the authors are aware, examining meteorological variables that lead to drought events.
This 8 weeks research aims to identify the most important meteorological variables that lead to droughts in the in Vermont, New Hampshire and eastern New York, using the ERA5 historic data reanalysis, from 1979 to 2018 and understand how the different variables have changed in the past 40 years. Therefore, the main objective will be to enhance our ability to forecast future dry periods in the area and to highlight the impacts of climate change on the region of study.
Data and Methods
The whole analysis was made using the ECMWF ERA5 surface parameters reanalysis. ERA5 has data reanalysis currently available from 1979 to 2018 and replaced the previous ERA-Interim. The new ERA5 has over 150 hourly variables and in this study the quarter degree resolution was used.
Before starting the analysis, as a first check, hourly measurements of 2m temperature, precipitation, snowfall, snow cover and evaporation were compared between ERA5 and the Burlington airport (VT) station data and the Essex Junction (VT) station data. The variables comparisons were satisfactory, considering all the possible sources of errors, with temperature being the most reliable variable (when a linear regression was performed between the station temperature values and the ERA5 grid point values, the r square was 0.99).
To start the analysis, 32 different monthly anomalies were calculated using ERA5, with the following steps:
Dew point depression was first calculated by taking the difference between temperature and dew point temperature on an hourly base.
Variables considered as part of the water budget of single grid points were first added to create daily values. Hence, daily values of precipitation, evapotranspiration, and snowfall were created by adding each hourly value in the grid cell during a 24h period. Otherwise, daily values that are not part of the water budget, were computed by taking the average of the hourly values over a 24h period. Therefore, values such as CAPE, temperature, snow cover, soil moisture, and soil temperature are averages of the 24-hourly values for each day. At this point, daily total soil moisture and daily soil freezing level were calculated.
Daily total soil moisture is a sum of the moisture of the 4 soil levels in ERA5 scaled by each layer thickness in millimeters. The following is the formula for total daily soil moisture:
TDSM = DSM1*(70) + DSM2*(140) + DSM3*(510) + DSM4*(1170)
Where TDSM is the total daily soil moisture, DSM is the daily soil moisture of each layer. After this computation, TDSM practically represents the amount of water, in liters per meter square, that would be present if the first 189cm of soil were to be squeezed out. TDSM is crucial to this study as a low TDSM is meant to represent a drought.
Daily soil freezing level is the thickness of the number of layers with soil temperature at or below zero degrees Celsius. For example, if only soil level 1 was below freezing, the daily soil freezing level would be 70mm. Otherwise, if only soil level 2 and 4 were below freezing, while layers 1 and 3 were above, the daily soil freezing level would be (140+1170) 1310mm.
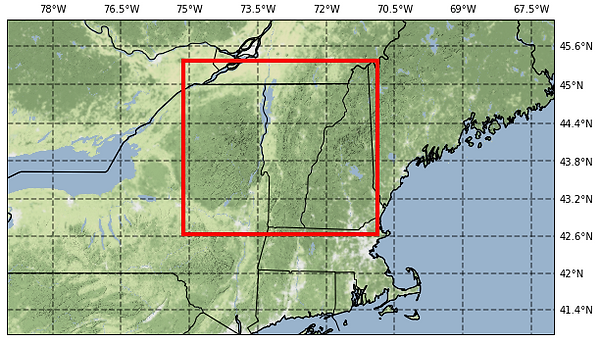
From here, monthly averages were calculated using all the daily values in each grid point, for the total 480 months (12 months per year over 40 years of data), and further, all the monthly values in each grid point were averaged over the whole area of study (Vermont, New Hampshire and eastern New York). Latitudes: 42.665-45.375, Longitudes: 284.875-289.125 [see figure].
Having the monthly values over the domain, average monthly values were calculated. Average monthly values were calculated by taking the average of all the monthly values of a single month over the 40 years period for a total of 12 values (one per each month (i.e. all January’s)) per variable.
Further, after calculating the monthly values and the average monthly values, monthly anomalies were performed by taking the difference between the monthly value and the average monthly value.
Anomalies were important to calculate because they are easy to visualize and interpret, especially for variables affected by seasonal variations. A total of 32 variables were finalized.
Once all the 32 anomalies were computed, a multi linear regression was run only on the summer months to understand which of the 31 variables anomalies had the largest impact on the total summer soil moisture anomaly.
The 32 anomalies are:
Soil moisture, Winter temperature, Previous summer soil moisture, January temperature, February temperature, March temperature , Winter freezing depth, January freezing depth, February freezing depth, March freezing depth , Winter snow cover, January snow cover, February snow cover, March snow cover, Spring snowmelt, previous month soil moisture, CAPE, Previous month precipitation, Precipitation, Previous month temperature anomaly, Temperature, Previous month precipitation, Dew point depression, Previous month dew point depression, Cloud cover, Previous month cloud cover, Wind speed, Previous month wind speed, Winter liquid precipitation, January liquid precipitation, February liquid precipitation, March liquid precipitation.
Results and Interpretation
Multiple Linear regression
The Multiple Linear Regression was used to predict total moisture anomaly during the summer from 31 other anomalies.
The MLR was computed a second time with only the 15 most relevant variables, and finally computed a third time with only the 9 most relevant variables and the result is shown in the following table. Blue color indicates a positive correlation, while red color indicates a negative correlation.
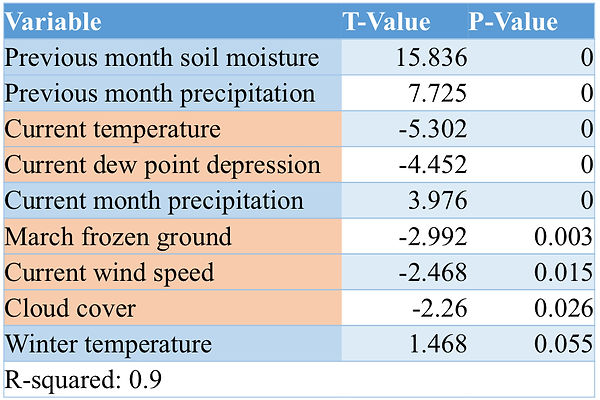
As the table shows, the most important variable that affects droughts is the preexisting soil moisture condition. This shows how soil moisture is a variable that changes slowly through time, and a major drought must be anticipated by several months of dry conditions before occurring.
Regarding variables other than soil moisture, precipitation and air temperature have the largest impact on the soil moisture itself, with precipitation being the most important of the two. This is consistent with most commonly used drought indices, such as the Palmer Drought Severity Index (PDSI)[Palmer 1965] that uses only precipitation and air temperature, or the Standard Precipitation Index (SPI)[McKee et al. 1993] that uses only precipitation. Both the PDSI and the SPI have a large impact on the U.S. Drought Monitor, the most widely used operational drought-monitoring tool in the United States [Hobbins et al. 2016].
Air moisture, wind speed and cloud cover are all variables that have important effects on soil moisture by altering the amount of evapotranspiration. These variables can apport errors in the drought indices, and are important to forecast future droughts.
Note that the cloud cover has a negative correlation, and may seem incorrect. In fact, the signal is mixed because in this study average cloud cover was not separated by diurnal cycle. Nighttime cloud cover has most likely a negative correlation with soil moisture by limiting the amount of dew, while daytime cloud cover should have a positive correlation by enhancing evapotranspiration. This however does not change the overall analysis.
Probably one of the most interesting results, is the influence of winter variables over the summer in the area of study. March frozen ground level has a negative correlation. We suppose that a strongly frozen ground in march would limit the amount of infiltration during spring snowmelt and delay the vegetation boom. Such conditions would prepare the soil moisture, previously stored in the ground, to be quickly depleted at the start of the summer. For similar reasons, winter temperature has a positive correlation, meaning that a warmer winter would probably encourage water penetration in the ground and liquid precipitation.
Naturally, the above analysis can also be made in reverse, to predict moist months.
Trends over the last 40 years
After understanding what variables affect the most the moisture in the soil, the trends over the past 40 years of these variables were plotted.
First, the trend of soil moisture was performed in the following graph, where summer drought refers to a soil moisture anomaly below one standard deviation during the months of June, July or August:
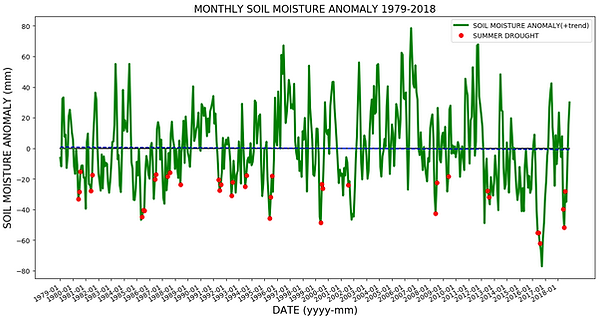

The long-term trend in the soil moisture change is near to zero or slightly negative (slope of -0.02 mm/yr), meaning that during the last 40 years there has been no discernible trend. At the same time, the summer soil moisture has been conversely increasing by 0.2mm/yr, meaning that summer soil moisture has been increasing while the rest of the year soil moisture has been strongly decreasing. The decrease in winter soil moisture is possibly due to modifications in the frozen front of the ground during the winter, that could have impacts on the density gradients, that would, in turn, affect the amount of water being transported toward the surface from deeper soil during the cold season. With this seasonal mechanism being reduced by climate change, more moisture could be left in the deep ground. The physical processes behind the relationship of summer soil moisture anomalies and winter frozen ground levels, need more investigation.
In the region, soil moisture tends to be high during the winter and low during the summer, therefore, with the found trends, seasonal variability has been reduced. It is important to notice how summer of 2016 had, by far, the lowest soil moisture values in at least 40 years, followed right after by the summer of 2018.
As previously discussed, the main variables affecting soil moisture are precipitation and temperature:

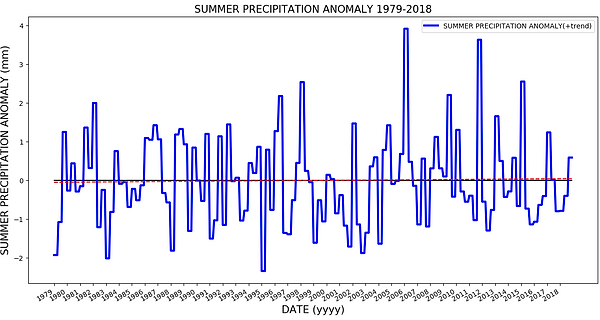
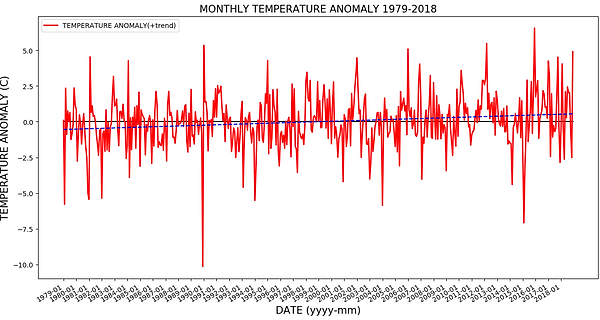

The long-term trend of precipitation is zero year round, meaning that the trend of increasing moisture from the previous century stalled, while during the summer, precipitation is only slightly increasing by 0.0025 mm/yr . However, the long-term temperature trend is positive, with an increase of almost one whole degree Celsius over the past 40 years, consistent with multiple climate studies on anthropogenic climate change. The temperature increase varies by season, with a total increase of 0.82C during the summer and 1.2C during the winter. As discussed in the previous session, temperature is negatively correlated with soil moisture, and consequently if temperature is increasing while precipitation remains constant, the soil moisture should decrease, not matching increasing summer soil moisture trend. Therefore, smaller variables of the multiple linear regression are impacting the soil moisture positively.
The dew point depression, wind speed and cloud cover are all variables that affect evapotranspiration.

The summer evapotranspiration has been slightly increasing, mostly due to the increase in summer soil moisture (therefore with more moisture, more water can evaporate).
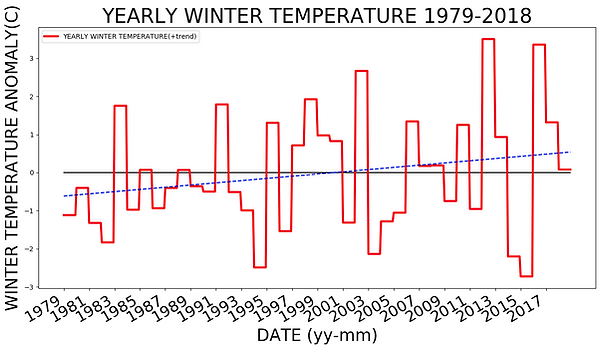
Consequently, the increase in summer moisture can only be a result of the changes happening in the winter season.
The winter temperatures over the last 40 years increased by over 1.2C, allowing the ground to stay unfrozen longer than before, probably increasing water infiltration.
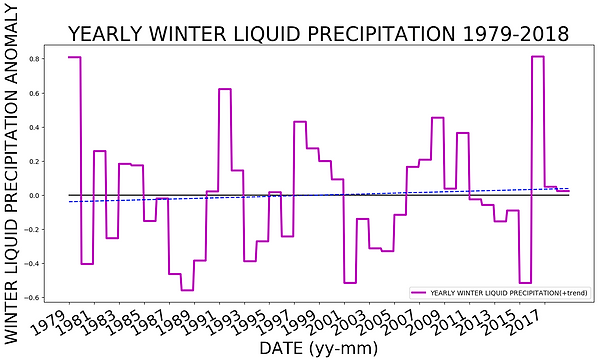
Another consequence of a warmer winter is the increase in winter rainfall events, that with an unfrozen ground can penetrate the soil. The graph highlights the positive trend in winter liquid precipitation.
The 2016 drought
The summer of 2016 was the driest in at least the last 40 years, with over 50 L/m^2 of deficit on average over the Vermont, New Hampshire and eastern New York area.
Several factors came together to seriously affect the soil conditions:
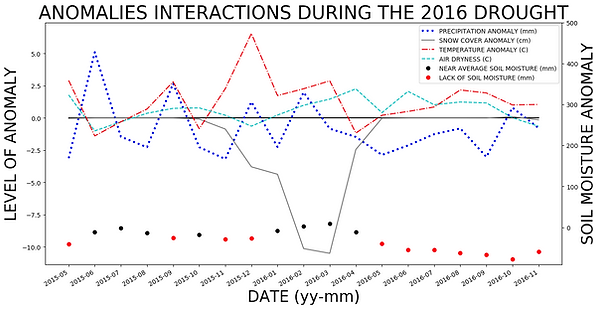
To start, the preceding 2015 fall/winter of 2015 had below average soil moisture, resulting in a soil moisture deficit at the start of the year. The winter of 2015–16 was abnormally warm (+6C above average in December) and lacked in snowfall. Although winter rain was useful to restore some of the moisture deficit, it was certainly not enough to face the upcoming summer. Even with an unfrozen early spring ground, the magnitude of spring recharge from snowmelt was strongly reduced, as there was almost no snow to melt.
During the 2016 summer, there was a lack of precipitation, mostly due to a high atmospheric stability (not shown), temperatures remained above average by one to two degrees celsius, the air was dry, and windy conditions persisted (not shown), all which contributed to the drying of the soil.
The mix of all these favorable conditions for drought created the driest summer in at least the last 40 years.
Conclusion
This study highlights what meteorological variables affect the soil moisture in the region of Vermont, New Hampshire and eastern New York. In agreement with most drought indices, soil moisture is found to be heavily affected by precipitation and temperature, with precipitation having the largest contribution. Yet, other summer variables, such as air dryness, wind speed and cloud cover have meaningful impacts on the soil conditions and could lead to errors in the drought indices calculations. Additionally, this research highlighted how the soil moisture in the area of Vermont, New Hampshire and eastern New York is also affected by the climate and meteorological conditions occurring during the previous winter season in the studied region, which can be crucial in the forecast and preparation of eventual future droughts.
Moreover, the long-term analysis showed how in the last 40 years, soil moisture and precipitation show no significant trend during the year, while soil moisture increased during the summer. Temperature has increased by almost one degree Celsius, with a larger increase during the winter compared to the summer. Therefore, on average the seasonal variation in temperature and soil moisture between summer and winter is decreasing. Winters nowadays are warmer and can probably allow more water to infiltrate the ground, increasing the summer soil moisture against the drying effect of warmer temperatures.
Unfortunately, with the increasing temperatures, the magnitude of droughts could become stronger, especially if the winter conditions do not provide the needed moisture excess.
Those concerns became real in 2016 as summer precipitation were scarce and the summer was warm and dry, not supported by moisture from the previous winter, which remained snowless. Winter precipitation had to restore the lack of moisture from the previous year, rather than prepare support for the following summer.
Droughts, like the one in 2016, may become more frequent and/or intense in the future as temperatures continue to rise and winter dynamics change, which could lead to significant impacts on water availability in the region.
Future Work
More analysis is needed to understand the changing winter soil moisture, as soil dynamics are more complex when the ground has a mix of solid and liquid water.
The analysis was made over the entire region of Vermont, New Hampshire and eastern New York, a region that comprises three different climate regions. In the future, the same analysis could be made over singular climate regions to discern the particularities linked to the specific climates.
Furthermore, this study was made using only surface variables. Hence, the analysis could be made by taking into consideration trends in the upper air, such as geopotential anomalies or analyzing circulation pattern and transport of moisture and temperature at different pressure levels during dry periods to have a better understanding of the trends shown in this research.
Acknowledgments
I would like to thank my mentors Caitlin and Lesley-Ann (University of Vermont) for their time, dedication and insightful feedback. A special thanks to Mary from the University of New Hampshire, Glenn and Rob from the US Geological Survey for their feedback. This research was funded by NSF Grant OIA-1556770.
References
-Copernicus Climate Change Service (C3S) (2017): ERA5: Fifth generation of ECMWF atmospheric reanalysis of the global climate . Copernicus Climate Change Service Climate Data Store (CDS), date of access. https://cds.climate.copernicus.eu/cdsapp#!/home
-Hobbins, M.T., A. Wood, D.J. McEvoy, J.L. Huntington, C. Morton, M. Anderson, and C. Hain, 2016: The Evaporative Demand Drought Index. Part I: Linking Drought Evolution to Variations in Evaporative Demand. J. Hydrometeor., 17, 1745–1761
-McKee, T. B., N. J. Doesken, and J. Kleist, 1993: The relationship of drought frequency and duration to time scales. Preprints, Eighth Conf. on Applied Climatology, Anaheim, CA, Amer. Meteor. Soc.
-Palmer, W. C., 1965: Meteorological drought. U.S. Weather Bureau Research Paper.
-Pederson, N., A. R. Bell, E. R. Cook, et al. 2013: Is an epic pluvial masking the water insecurity of the greater New York City region? J. Climate, 26, 1339–1354.
-Sweet, S. K., D. W. Wolfe, A. DeGaetano, R. Benner 2017: Anatomy of the 2016 drought in the Northeastern United States: Implications for agriculture and water resources in humid climates. Agric. For. Meteorol., 247, 571–581